
Broadcast Monitor · A practical introduction
Broadcast scopes turn a video or audio signal into a measurement you can read. They help you recognize problems, compare sources, and make adjustments with a clear reason behind them.
Click any screenshot for a closer look. The examples use sample video playback, a Professional feature; individual monitoring tools are available in the editions described below.
The same image can look different on a bright laptop, a dim control-room display, and an audience member's television. Room lighting and display settings influence your judgment. After watching one camera for a while, a color cast can even begin to feel normal.
Scopes give you another reference: the signal itself. They complement a good monitor and a careful eye, helping you tell the difference between an intentional look and something you need to fix.
You do not need every display open at once. Choose the view that answers the question in front of you.
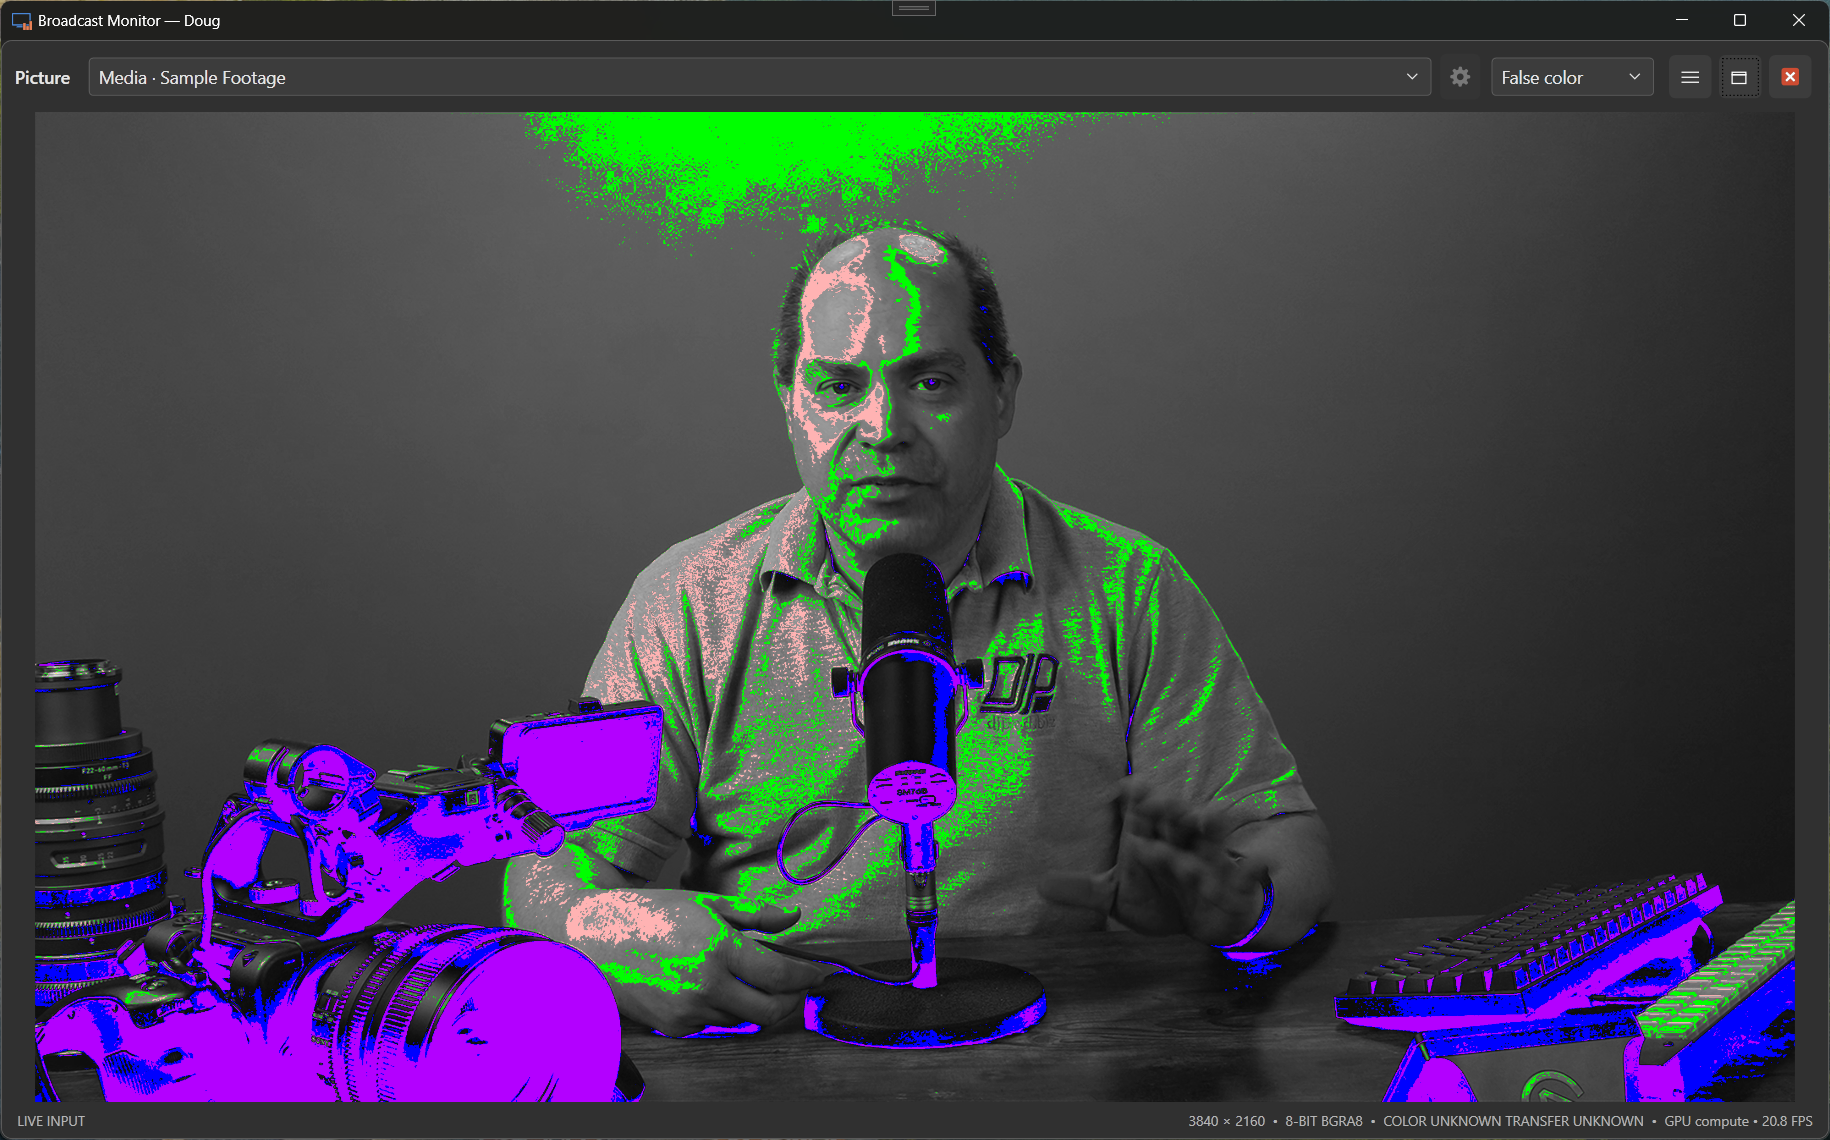
False color replaces the image's normal colors with colors that represent brightness ranges. Instead of trying to judge a face against a bright background, look at the range that face falls into.
Try it during rehearsal: frame your presenter, turn on false color, and observe how the face changes as you adjust exposure. Use the display's scale and your intended look; there is no single exposure value that suits every face or lighting design.
False color is included in all three editions.
Zebras place a striped overlay on parts of the image that meet a brightness condition. They make it easy to locate those areas without looking away from the picture.
Try it on a bright stage: use high zebras to see which parts of a white shirt or projection screen cross your selected threshold. A zebra warning invites a closer look; it does not automatically mean the image is clipped.
Free includes high zebras. Express and Professional include all zebra options.
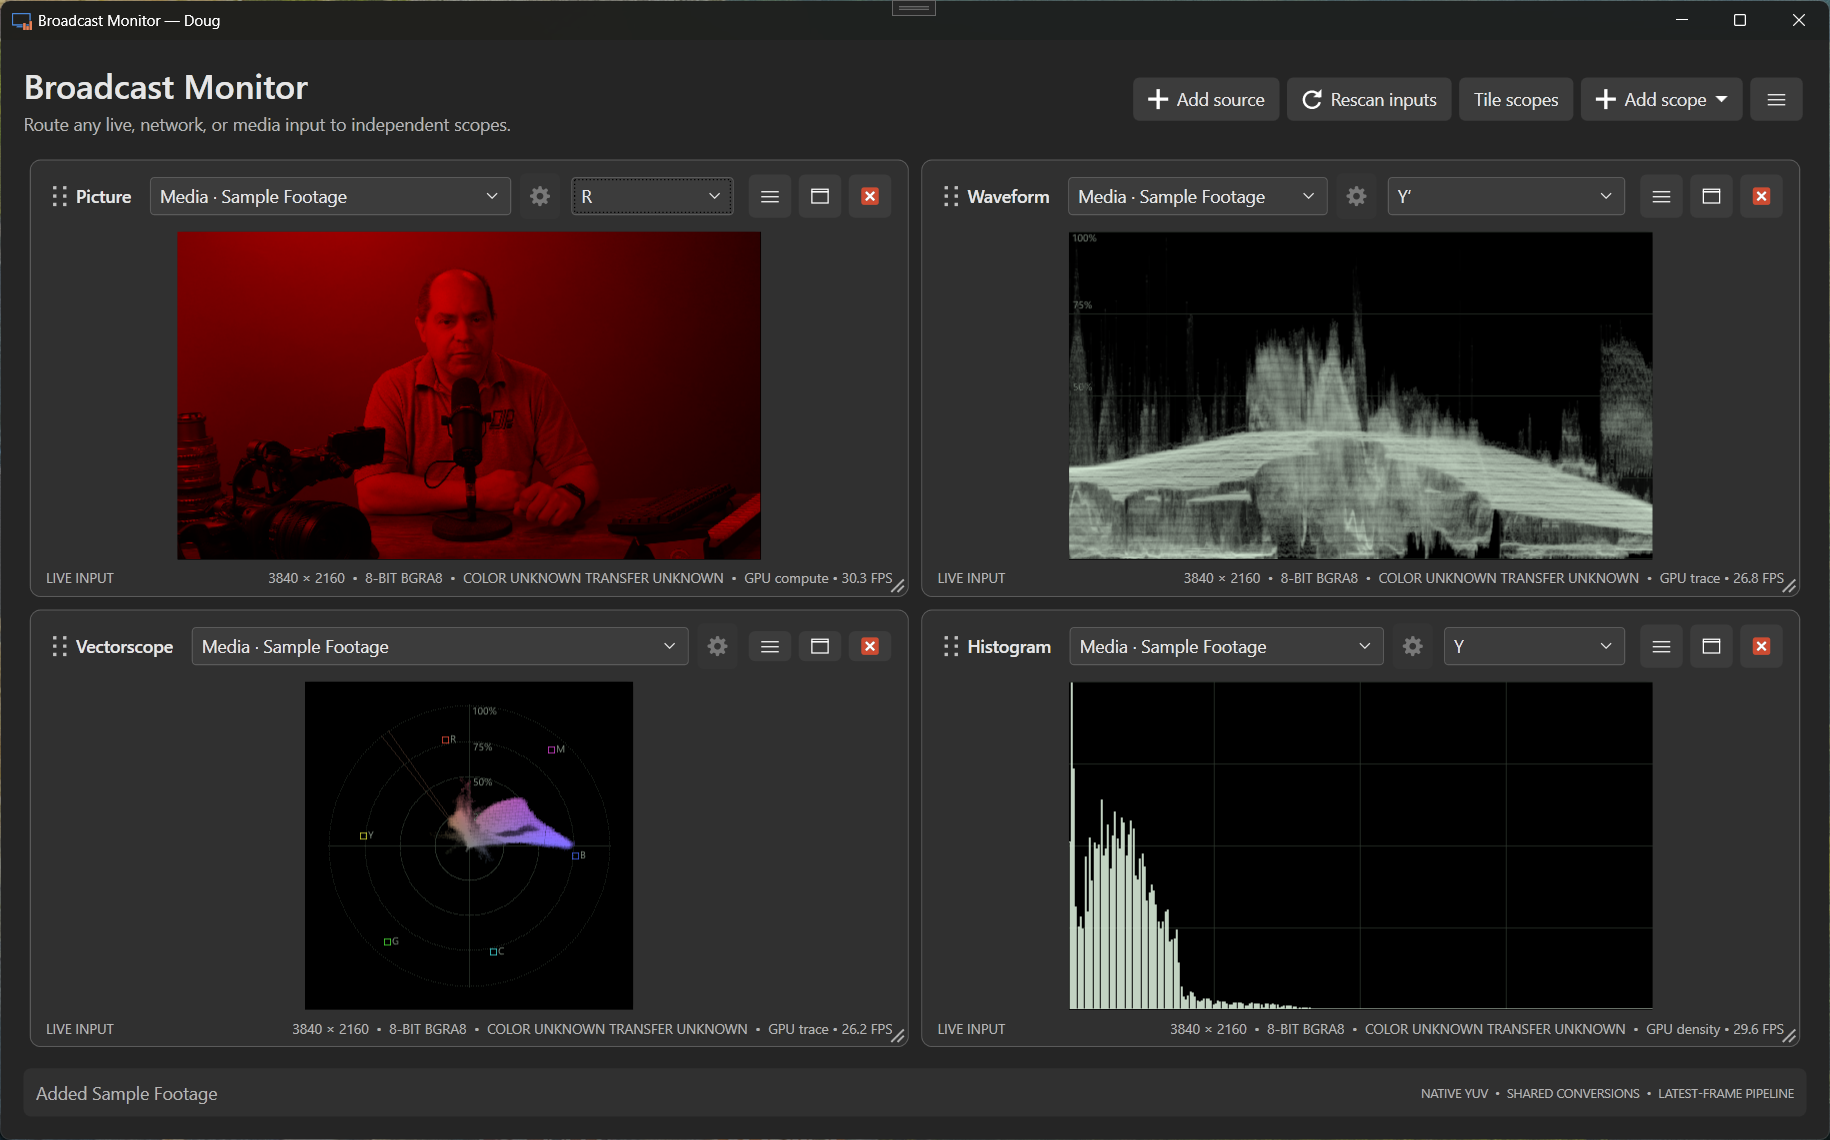
Detail enhancement boosts fine edges in the RGB picture view, with optional grayscale. Adjust its strength to make detail easier to judge, and use the threshold to limit enhancement of low-level noise. Express and Professional include these controls.
During camera setup: maximize the picture pane, enable detail enhancement, and watch fine edges as you adjust focus. Turn it off again to judge the ordinary picture. Enhancement helps reveal detail; it cannot restore detail that the camera did not capture.
This is a viewing aid. It does not modify the captured samples or the signal measured by the waveform, vectorscope, or histogram. Zebra thresholds still use source measurements.
If you send a composed monitoring layout to an output, its picture pane includes the enhancement. Disable it when you want that output to show the ordinary picture.
A waveform plots signal level vertically and image position horizontally. Bright parts appear higher on the display; dark parts appear lower. That relationship helps you connect a reading to an area of the picture.
During a live event: check whether a spotlight is pushing a presenter's face much higher than the rest of the scene, or compare black and highlight levels as you move between cameras. Look for lost separation at the extremes, then check the picture as you adjust.
Express includes Y brightness views and parades. Professional adds the full waveform mode selection.
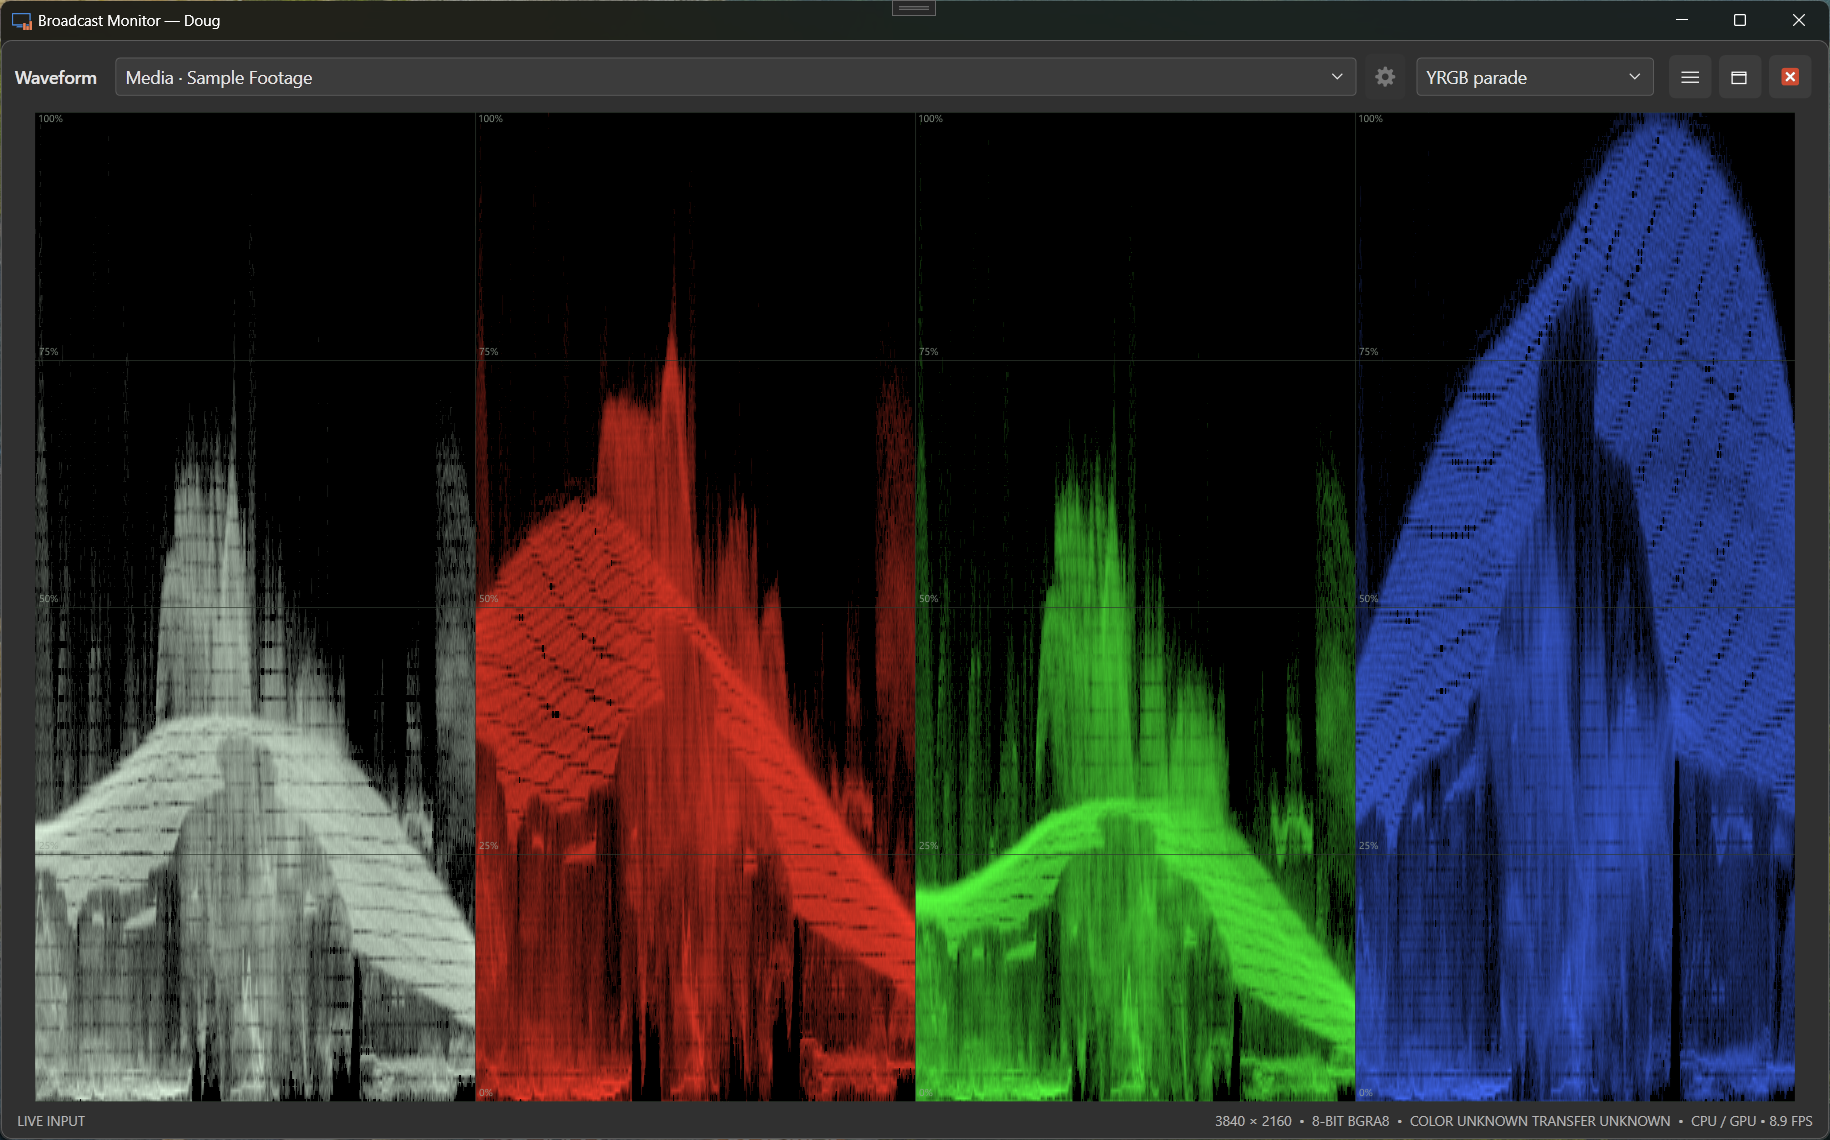
A parade separates signal components into displays side by side. An RGB parade, for example, lets you compare the red, green, and blue channels.
On a subject that should be neutral, a channel that sits noticeably higher than the others can help explain a color cast. Use a known neutral subject when matching balance: a red backdrop should have more red, so unequal channels across an entire scene are not automatically a problem.
Production payoff: a more informed starting point for camera matching, especially when cuts reveal brightness or color differences.
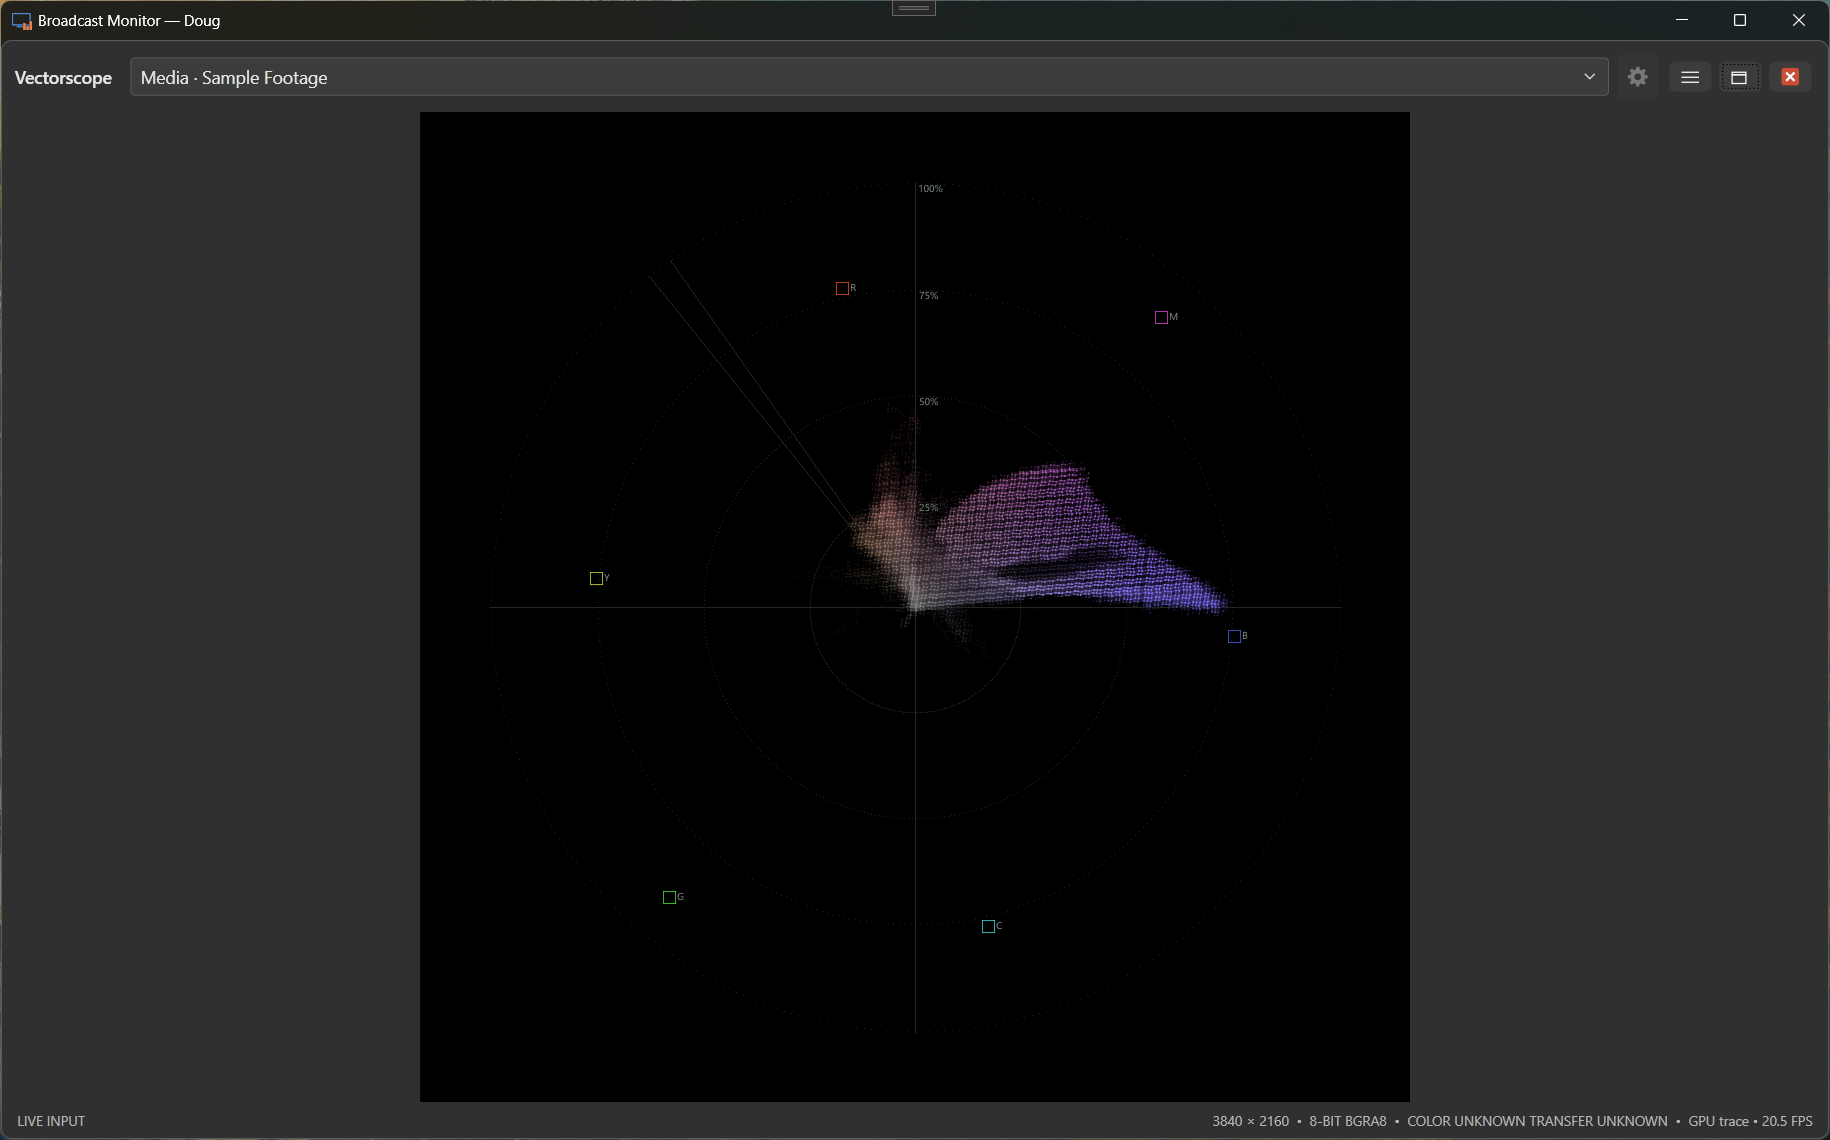
A vectorscope shows color as direction and distance from the center. Direction represents hue; distance represents saturation, or how strong the color is. Neutral content stays near the center.
During camera matching: compare the same subject under the same lighting. Does one camera push color in a different direction? Is its color much stronger? The vectorscope helps make those differences visible.
Included in Express and Professional.
A histogram groups pixels by level. It shows how much of the image falls into dark, middle, and bright ranges, giving you a quick overview of the signal's distribution.
During setup: watch how the distribution changes when the stage lights come up. A concentration at one edge is worth investigating, but it may simply reflect the scene. Unlike a waveform, a histogram does not tell you where those pixels are in the image.
Express includes Y and parade histograms. Professional includes all histogram modes.
Express and Professional let you route source channels into a stereo listening mix independently of the channels used for phase analysis. Enable Listen to hear that mix through the default Windows playback device. Routing changes take effect without reopening the device, so you can investigate a channel while keeping your monitoring session running.
Loudness readings add momentary, short-term, and integrated measurements to the channel-level displays. They help you compare a brief peak with the perceived level over time. Professional also adds spectrum and waterfall analysis.
See whether audio is present and how close it gets to the top of the available range. Compare a quiet speaker with a loud musical cue and leave room for unexpected peaks.
Included in Express and Professional.
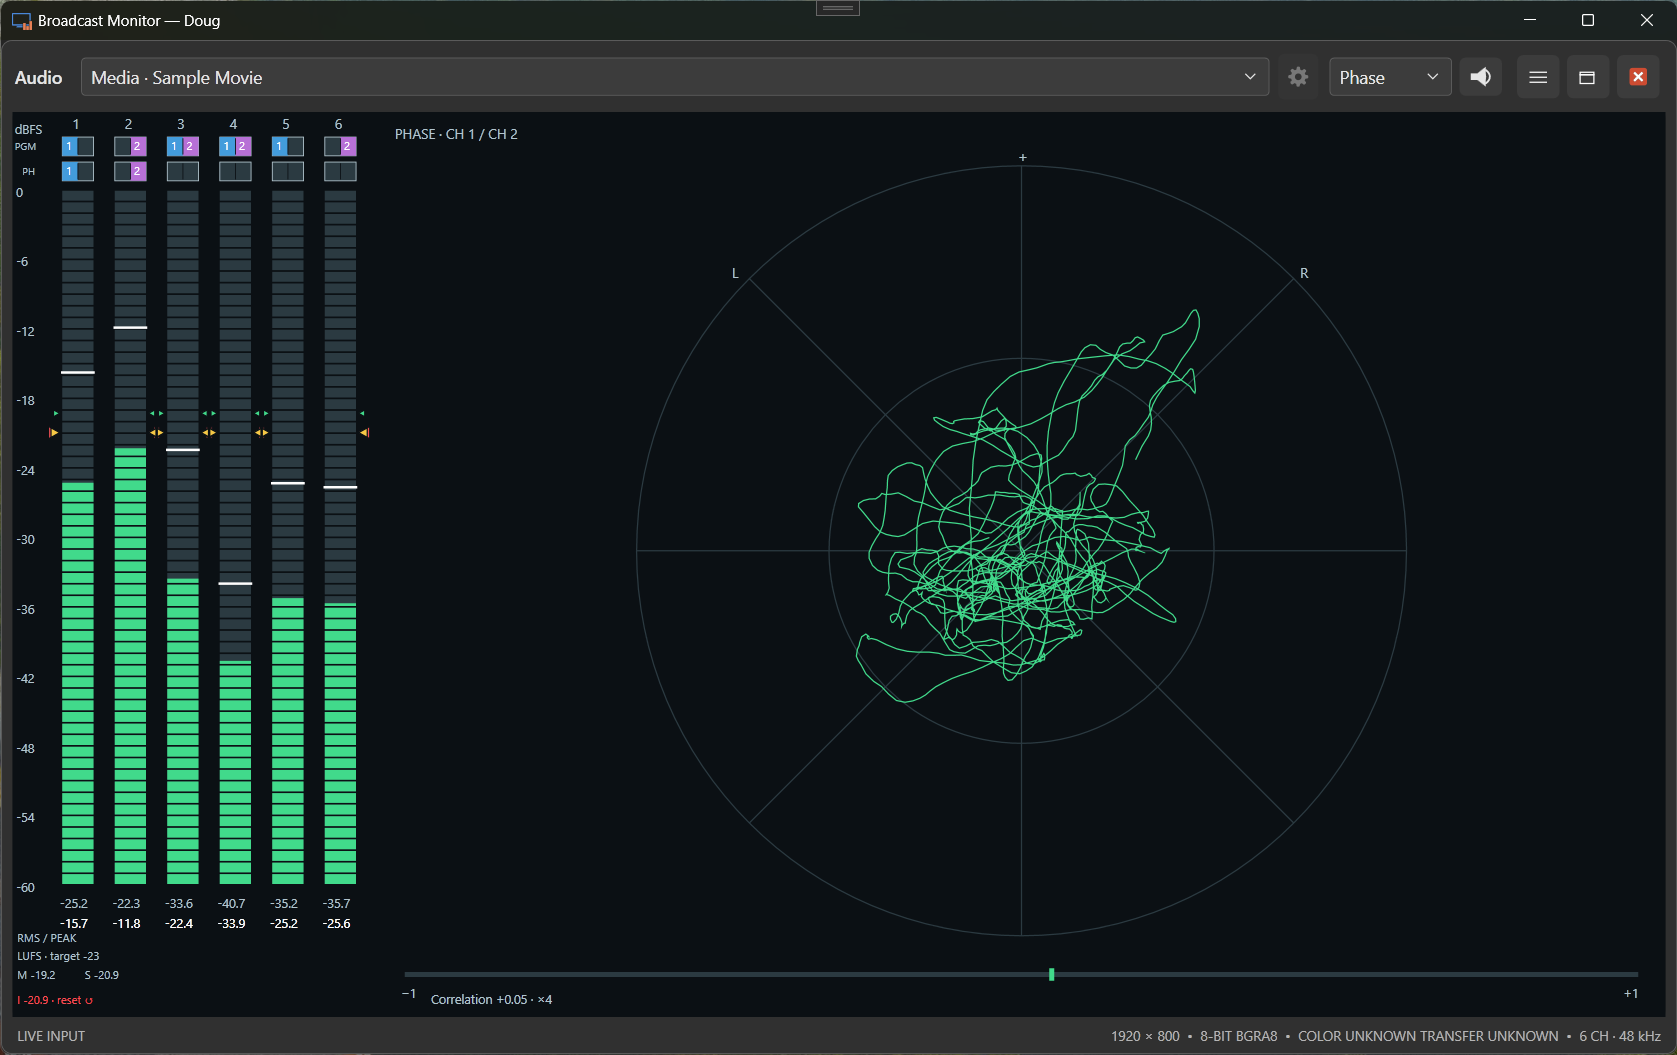
Inspect the relationship between the left and right channels. Unusual phase behavior can prompt a mono listening check, where some material may weaken or cancel.
Included in Express and Professional. Always listen as well as watch.
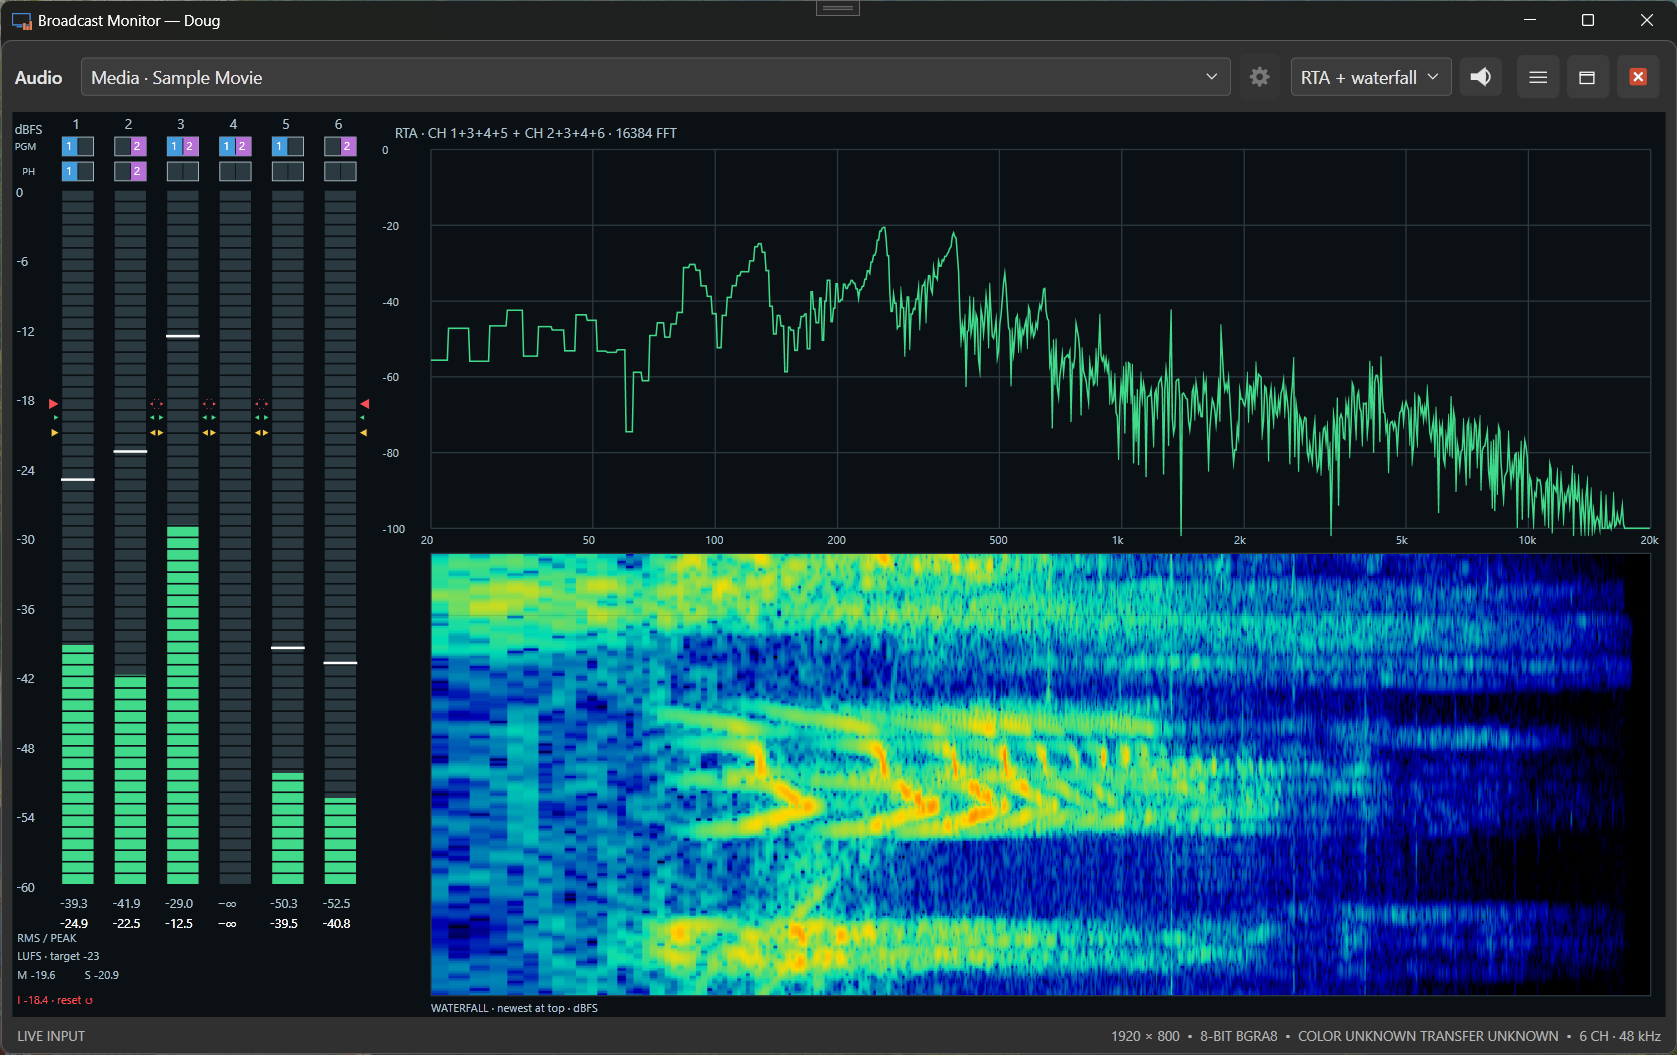
See how audio energy is distributed across frequencies. It can help you investigate a low-frequency rumble or a persistent tonal sound and give you a clearer direction for further listening.
Included in Professional.
Start with a representative camera shot under the show lighting. Set exposure and white balance for the look you want, watching the picture and the relevant scopes together.
Use a comparable subject and framing. Check brightness on the waveform, compare channels on a parade, and inspect hue and saturation on the vectorscope.
Keep useful views visible during the show. When lighting, sources, or audio change, use those references to investigate quickly. Save the workspace for the next production.
Signal precision, spatial sampling, and update rate are different things. Understanding the controls helps you keep useful measurements on screen while managing your computer's workload.
Maximizing a pane also helps concentrate processing on the view you are using. Hidden scope analysis pauses while input connections, file playback, and enabled audio listening continue. Restore the layout to resume current readings; the hidden meters do not keep measuring during suspension. With program output running, all panes continue rendering for that output.
Full input resolution includes every source pixel in the analysis. Reduced sampling processes fewer positions to reduce work, so a tiny highlight or brief spatial detail may be missed. Keep full resolution when those details matter.
Half frame rate makes waveform and vectorscope views update at half the input cadence, up to 30 updates per second. It leaves spatial sampling unchanged. It can suit a steady camera-matching task, while rapid changes benefit from more frequent updates.
CRT trace (GPU) connects selected samples into traces. Turning it off uses density rendering, which can reduce the workload. Connecting samples changes the visualization; it does not add measured signal detail. Supported renderers can also fall back when necessary.
Watch the update rate in each pane and evaluate your actual video, not just a test pattern. Source resolution, image complexity, plot size, scope count, and other applications all affect performance. See the computer and capture-hardware guidance.
Explore picture monitoring in Free, add everyday scopes with Express, or choose Professional for the expanded toolset, playback, and hardware output.